
Oracleの性能分析ツールで無償なのはStatspackですが、有償のDiagnostics Packライセンスを購入することで使用できるのが、Statspackよりも高機能なAWR(Automatic Workload Repository)です。
詳細な性能情報が参照できるので、ライセンスを持っているなら是非使ってみてほしいです。
AWRとは
性能情報のスナップショットを時間断面で取得し、その時間断面同士で比較するツールです。
性能レポートはAWRレポートと呼ばれ、出力はtext形式とHTML形式を選択できます。

Oracle Database AWR入門
Oracle Databaseの性能を分析する際に便利な機能として使えるのがAWRです。性能分析はとても奥が深いのですが、とても面白い分野でもあります。今回はAWR入門として、AWRとは何かを紹介したいと思います。
dekiruengineer.com
2023.03.18
AWRスナップショットの間隔確認
AWRスナップショットの取得間隔は以下のコマンドで確認できます。
以下の例はデフォルトの1時間毎となっています。
SQL> select snap_id, to_char(begin_interval_time, 'yyyy/mm/dd hh24:mi')
  2    from DBA_HIST_SNAPSHOT
  3    order by snap_id;

   SNAP_ID TO_CHAR(BEGIN_IN
---------- ----------------
        34 2020/01/09 10:00
        35 2020/01/09 11:00
        36 2020/01/09 12:00
        37 2020/01/09 13:00
        38 2020/01/09 14:00
        39 2020/01/09 15:00
        40 2020/01/09 16:00
        41 2020/01/09 17:00
        42 2020/01/09 18:00
AWRレポートの出力方法
AWRレポートの出力は、oracle内で用意されている以下のSQLファイルを実行します。
[oracle@oel77 ~]$ ls -l $ORACLE_HOME/rdbms/admin/awrrpt.sql
-rw-r--r-- 1 oracle oinstall 8096 May 29  2017 /u01/app/oracle/product/18.0.0/dbhome_1/rdbms/admin/awrrpt.sql
AWRレポートをtext形式で出力してみます。
★の付いている場所がユーザが入力を求められる箇所です。
[oracle@oel77 ~]$ sqlplus / as sysdba
Connected to:
Oracle Database 18c Enterprise Edition Release 18.0.0.0.0 - Production
Version 18.3.0.0.0

SQL> @?/rdbms/admin/awrrpt.sql

Specify the Report Type
~~~~~~~~~~~~~~~~~~~~~~~
AWR reports can be generated in the following formats.  Please enter the
name of the format at the prompt.  Default value is 'html'.

'html'          HTML format (default)
'text'          Text format
'active-html'   Includes Performance Hub active report

Enter value for report_type: text  ★出力形式を入力。今回はtext形式としています
old   1: select 'Type Specified: ',lower(nvl('&&report_type','html')) report_type from dual
new   1: select 'Type Specified: ',lower(nvl('text','html')) report_type from dual

Type Specified:  text

old   1: select '&&report_type' report_type_def from dual
new   1: select 'text' report_type_def from dual


old   1: select '&&view_loc' view_loc_def from dual
new   1: select 'AWR_PDB' view_loc_def from dual


Current Instance
~~~~~~~~~~~~~~~~
DB Id          DB Name        Inst Num       Instance       Container Name
-------------- -------------- -------------- -------------- --------------
 2624196117     REPO18C                     1 repo18c        repo18c


Instances in this Workload Repository schema
~~~~~~~~~~~~~~~~~~~~~~~~~~~~~~~~~~~~~~~~~~~~
  DB Id      Inst Num   DB Name      Instance     Host
------------ ---------- ---------    ----------   ------
* 2624196117     1      REPO18C      repo18c      oel77

Using 2624196117 for database Id
Using          1 for instance number


Specify the number of days of snapshots to choose from
~~~~~~~~~~~~~~~~~~~~~~~~~~~~~~~~~~~~~~~~~~~~~~~~~~~~~~
Entering the number of days (n) will result in the most recent
(n) days of snapshots being listed.  Pressing  without
specifying a number lists all completed snapshots.


Enter value for num_days: 1  ★直近何日間のレポートを出力するか入力

Listing the last day's Completed Snapshots
Instance     DB Name      Snap Id       Snap Started    Snap Level
------------ ------------ ---------- ------------------ ----------

repo18c      REPO18C             23  09 Jan 2020 00:00    1
                                 24  09 Jan 2020 01:00    1
                                 25  09 Jan 2020 02:00    1
                                 26  09 Jan 2020 03:00    1
                                 27  09 Jan 2020 04:00    1
                                 28  09 Jan 2020 05:00    1
                                 29  09 Jan 2020 06:00    1
                                 30  09 Jan 2020 07:00    1
                                 31  09 Jan 2020 08:00    1
                                 32  09 Jan 2020 09:00    1
                                 33  09 Jan 2020 10:00    1
                                 34  09 Jan 2020 11:00    1
                                 35  09 Jan 2020 12:00    1
                                 36  09 Jan 2020 13:00    1
                                 37  09 Jan 2020 14:00    1
                                 38  09 Jan 2020 15:00    1
                                 39  09 Jan 2020 16:00    1
                                 40  09 Jan 2020 17:00    1
                                 41  09 Jan 2020 18:00    1
                                 42  09 Jan 2020 19:00    1


Specify the Begin and End Snapshot Ids
~~~~~~~~~~~~~~~~~~~~~~~~~~~~~~~~~~~~~~
Enter value for begin_snap: 41  ★AWRスナップショットの比較開始Snap Idを入力
Begin Snapshot Id specified: 41

Enter value for end_snap: 42  ★AWRスナップショットの比較終了Snap Idを入力
End   Snapshot Id specified: 42


Specify the Report Name
~~~~~~~~~~~~~~~~~~~~~~~
The default report file name is awrrpt_1_41_42.txt.  To use this name,
press  to continue, otherwise enter an alternative.

Enter value for report_name:  ★デフォルトの出力ファイル名を使うのでEnter押下

Using the report name awrrpt_1_41_42.txt

~省略~

End of Report
Report written to awrrpt_1_41_42.txt
SQL> exit
出力されたAWRレポートを確認します。
[oracle@oel77 ~]$ less awrrpt_1_41_42.txt
WORKLOAD REPOSITORY report for

DB Name         DB Id    Unique Name DB Role          Edition Release    RAC CDB
------------ ----------- ----------- ---------------- ------- ---------- --- ---
REPO18C       2624196117 repo18c     PRIMARY          EE      18.0.0.0.0 NO  NO

Instance     Inst Num Startup Time
------------ -------- ---------------
repo18c             1 08-Jan-20 12:26

Host Name        Platform                         CPUs Cores Sockets Memory(GB)
---------------- -------------------------------- ---- ----- ------- ----------
oel77            Linux x86 64-bit                    4     4       1       3.59

              Snap Id      Snap Time      Sessions Curs/Sess
            --------- ------------------- -------- ---------
Begin Snap:        41 09-Jan-20 18:00:18        57       1.8
  End Snap:        42 09-Jan-20 19:00:23        56       1.8
   Elapsed:               60.09 (mins)
   DB Time:                0.01 (mins)

Load Profile                    Per Second   Per Transaction  Per Exec  Per Call
~~~~~~~~~~~~~~~            ---------------   --------------- --------- ---------
             DB Time(s):               0.0               0.0      0.00      0.00
              DB CPU(s):               0.0               0.0      0.00      0.00
      Background CPU(s):               0.0               0.0      0.00      0.00
      Redo size (bytes):           4,420.3           6,813.1
  Logical read (blocks):             108.3             167.0
          Block changes:              24.8              38.2
 Physical read (blocks):               3.1               4.8
Physical write (blocks):               0.9               1.4
       Read IO requests:               0.1               0.2
      Write IO requests:               0.4               0.7
           Read IO (MB):               0.0               0.0
          Write IO (MB):               0.0               0.0
           IM scan rows:               0.0               0.0
Session Logical Read IM:               0.0               0.0
             User calls:               1.3               2.1
           Parses (SQL):              17.5              27.0
      Hard parses (SQL):               0.1               0.1
     SQL Work Area (MB):               0.0               0.1
                 Logons:               0.4               0.7
            User logons:               0.0               0.0
         Executes (SQL):              19.9              30.7
              Rollbacks:               0.0               0.0
           Transactions:               0.7

Instance Efficiency Percentages (Target 100%)
~~~~~~~~~~~~~~~~~~~~~~~~~~~~~~~~~~~~~~~~~~~~~
            Buffer Nowait %:   99.89       Redo NoWait %:  100.00
            Buffer  Hit   %:   99.99    In-memory Sort %:  100.00
            Library Hit   %:   99.30        Soft Parse %:   99.52
         Execute to Parse %:   11.98         Latch Hit %:   99.78
Parse CPU to Parse Elapsd %:  100.39     % Non-Parse CPU:   95.10
          Flash Cache Hit %:    0.00

Top 10 Foreground Events by Total Wait Time
~~~~~~~~~~~~~~~~~~~~~~~~~~~~~~~~~~~~~~~~~~~
                                           Total Wait       Avg   % DB Wait
Event                                Waits Time (sec)      Wait   time Class
------------------------------ ----------- ---------- --------- ------ --------
DB CPU                                             .1             36.0
process terminate                        2         .1   52.69ms   30.2 Other
log file sync                            3         .1   31.56ms   27.2 Commit
Disk file operations I/O                17          0   53.06us     .3 User I/O
PGA memory operation                    99          0    4.90us     .1 Other
SQL*Net break/reset to client            2          0   31.00us     .0 Applicat
SQL*Net message to client               67          0  835.82ns     .0 Network
ADR block file read                      0          0               .0 Other
ADR block file write                     0          0               .0 Other
ADR file lock                            0          0               .0 Other

~省略~
AWRレポートをhtml形式で出力すると、以下のような感じになります。
[oracle@oel77 ~]$ sqlplus / as sysdba
Connected to:
Oracle Database 18c Enterprise Edition Release 18.0.0.0.0 - Production
Version 18.3.0.0.0

SQL> @?/rdbms/admin/awrrpt.sql

Specify the Report Type
~~~~~~~~~~~~~~~~~~~~~~~
AWR reports can be generated in the following formats.  Please enter the
name of the format at the prompt.  Default value is 'html'.

'html'          HTML format (default)
'text'          Text format
'active-html'   Includes Performance Hub active report

Enter value for report_type: html  ★html形式でレポート出力
(以下はtext形式と同じように入力します)
html形式で出力されたAWRレポートをブラウザで見ると、以下のような感じになります。
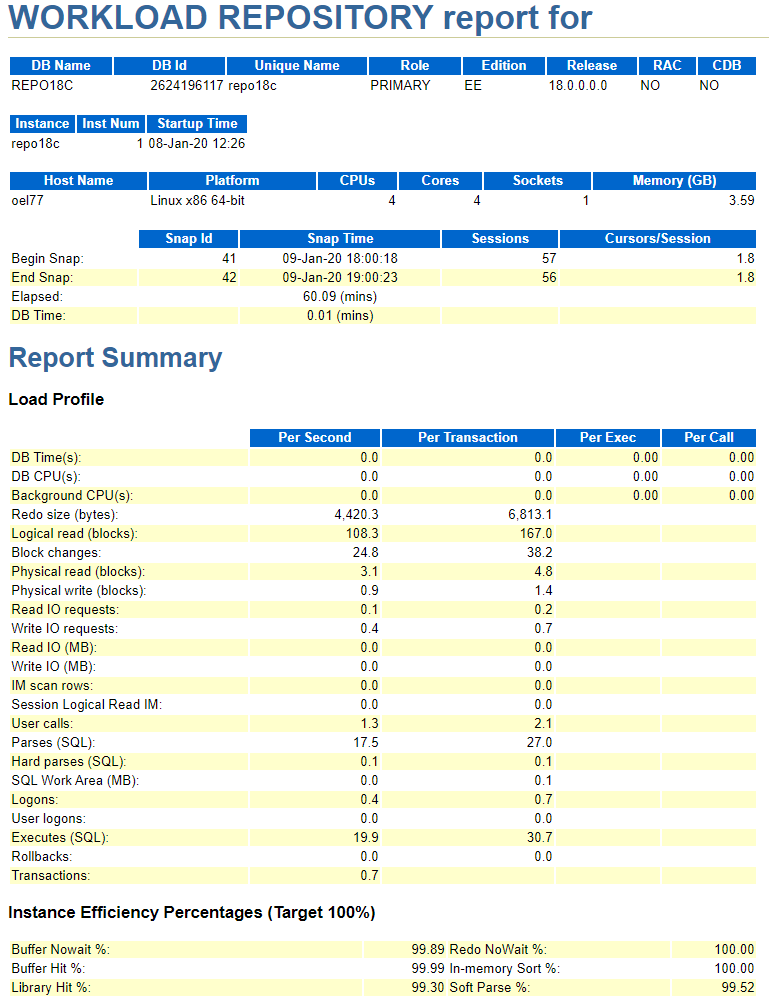
様々な情報がAWRレポートに記載されていますので、このレポートから性能分析を行います。
その他のAWRレポート
上記で紹介したのは一般的なAWRレポートですが、Oracle Databaseには様々なレポートが出力できます。
私がよく使用するものを以下に記載します。
2点のAWR期間比較(diffレポート)レポートの生成
SQL> @?/rdbms/admin/awrddrpt.sql
RAC環境のAWRレポートの生成
SQL> @?/rdbms/admin/awrddrpt.sql
RAC環境の2点のAWR期間比較(diffレポート)レポートの生成
SQL> @?/rdbms/admin/awrgdrpt.sql